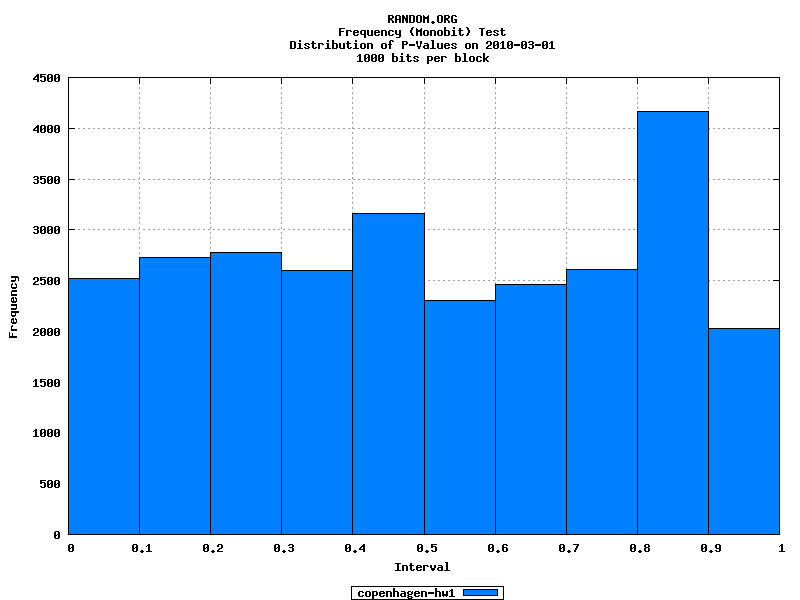
As was pointed out earlier, you shouldn't complain about those graphs if you're not aware of what they actually mean. I have a BS in math, and I couldn't figure out exactly what they're plotting without trying to dig through the values. Certainly they're not just plotting a distribution of the produced values. The graphs they show are based on statistical frequency analysis of their random numbers. The following graphs all represent analysis of the exact same data:
- Click image to enlarge.
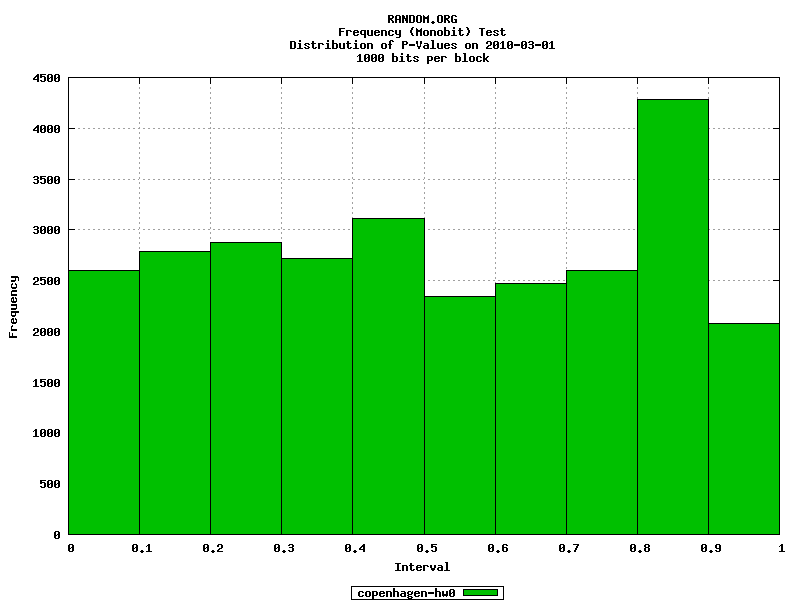
- Click image to enlarge.
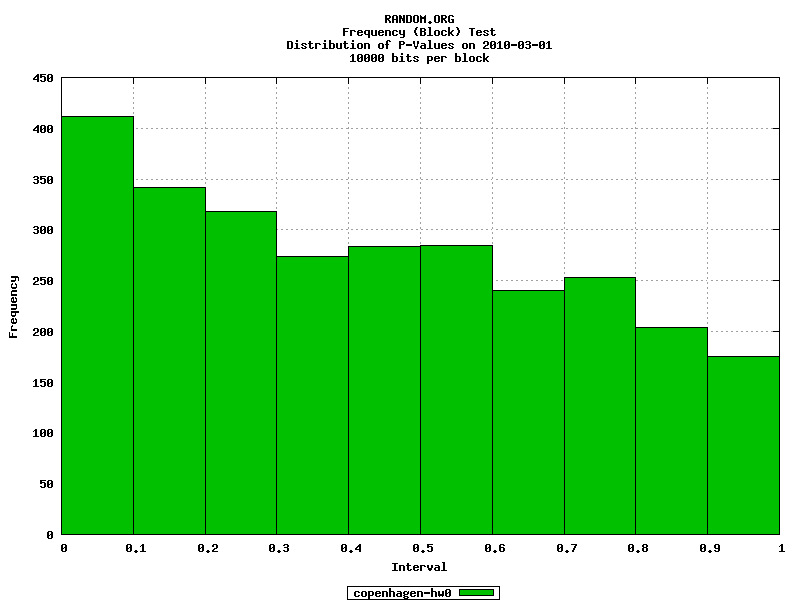
- Click image to enlarge.
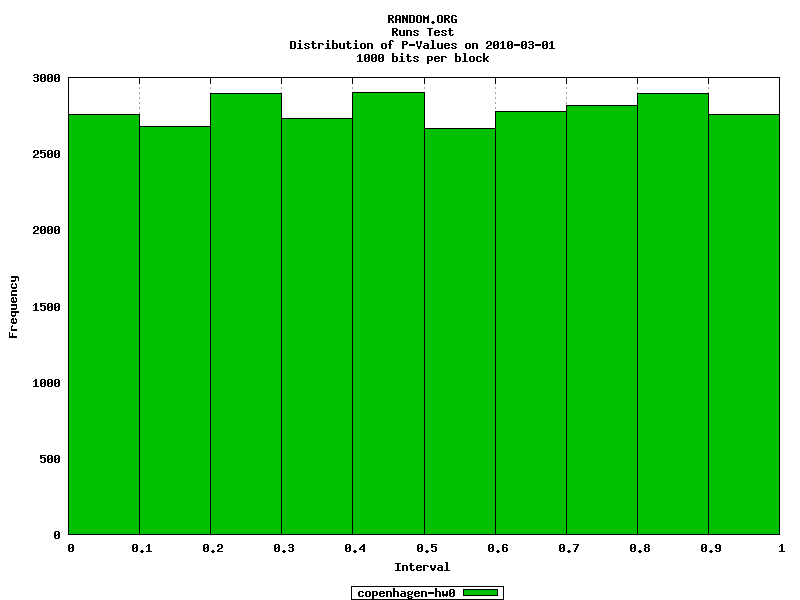
Just because the last one looks flat and the first two don't doesn't say anything about how random the numbers are if you don't know what's actually being plotted. It's the mathematical equivalent of saying that f(x)=3x^2 can't be a quadratic function because the graph of its derivative (f'(x)=6x) is a straight line and its antiderivative (F(x)=x^3) is an odd function.
Some people have been pushing for an alternative random number generator. Here is a plot of how the random numbers from the PHP rand() function are distributed:
- Click image to enlarge.

Here is the equivalent distribution from random.org:
- Click image to enlarge.

Your other alternative is to have a deterministic dice algorithm that would ensure that all rolls fit the proper distribution. However, it wouldn't be difficult to reverse-engineer such a system and predict what the rolls should be in a given attack based on the previous rolls. In a truly random sample, a given set of rolls are
completely independent of all previous rolls (the exact opposite of random numbers). The expectation values for various outcomes are not models that the random numbers are supposed to conform to. Rather, they're the statistical outcomes derived
from the random samples.
Instead of posting a single bad attack sequence that went bad, why don't you record every single roll you make for a full week. Post the results in here and we can determine how bad your luck actually is.