In statistics, a type I error (or error of the first kind) is the incorrect rejection of a true null hypothesis. A type II error (or error of the second kind) is the failure to reject a false null hypothesis.[1] (i.e. getting a false positive).
http://en.wikipedia.org/wiki/Type_I_and_type_II_errors
Which number do you roll the most?
Moderator: Community Team
Forum rules
Please read the community guidelines before posting.
Please read the community guidelines before posting.
-
BigBallinStalin

- Posts: 5071
- Joined: Sun Oct 26, 2008 10:23 pm
- Location: crying into the dregs of an empty bottle of own-brand scotch on the toilet having a dump in Dagenham
- Contact:
-
Metsfanmax

- Posts: 6619
- Joined: Wed Apr 11, 2007 11:01 pm
- Gender: Male
Re: Which number do you roll the most?
When doing statistics you have to be very careful to know what question you're actually asking (hence the danger of just pressing the Excel chi-squared button ;-P). In this case, there are two questions we may ask.degaston wrote:The last column is the expected number of rolls for each die face (1/6 of the total rolls). I used the Excel CHISQ.TEST function on each column of actual rolls with the last column as the expected range. I believe the output of the function is the p-value, and would assume that is uses the range size to determine the degrees of freedom.Metsfanmax wrote:Please be a little more specific about the calculation you did. The null hypothesis is that the dice are fair, so the expected frequency of ones for each user is 1/6 of their total number of rolls. You turn the observed number of ones/twos/threes/etc. into an observed frequency by dividing by the number of rolls for each user (e.g. the upper left cell would be 0.163). Once you calculate the chi-squared value (the sum of the squared deviations from that expected frequency, divided by the expected frequency), you then turn it into a p-value, given N = 10 degrees of freedom. Is that number in your final row, the p-value for each number?
I think it would be incorrect to perform the calculation as you described, because that would imply that the percentage that each value appeared was the actual sample size, and from the wiki page in your first link:Whatever a "Type II" error is?Assumptions
* Sample size (whole table) – A sample with a sufficiently large size is assumed. If a chi squared test is conducted on a sample with a smaller size, then the chi squared test will yield an inaccurate inference. The researcher, by using chi squared test on small samples, might end up committing a Type II error.
1) For a given player, what is the probability that their die rolls could have occurred from random chance, assuming the dice are fair?
2) For a given set of players, what is the probability that their die rolls could have occurred from random chance, assuming the dice are fair?
If we wanted to answer the first question, we would perform the calculation I linked to by summing up the squared differences of the number of ones, twos, etc. and the expected average (4524.5), and dividing by that average. We would get a chi^2 value of 7.2. There are 6-1 = 5 degrees of freedom in this sample (since there are 6 possible outcomes for the die). Consulting the Wiki page shows that this has a p-value of approximately 0.20. This means that a distribution of dice at least as non-uniform as this would occur 20% of the time you performed this experiment (this is not enough to reject the hypothesis that the dice are fair -- if this would occur 20% of the time with random dice, there's little confidence in concluding the dice are unfair). If you are uncertain, just do your Excel chi-squared test on the first row, using 4524.5 as the expected frequency for each column. It should give you something similar to what I calculated.
Note that the actual number of dice rolls doesn't factor into this analysis explicitly. We have more confidence in our results because the dice have been rolled several thousand times, but you could do this analysis for one die roll or 10 or 100,000 and get a p-value if you want. This is why statistics is tricky -- you can calculate all you want, but you need to be careful in how you apply it. 30,000 rolls is enough to be fairly confident that we have a decent sample though.

Re: Which number do you roll the most?
I interpreted this to mean that you were saying that the calculation should be performed using the percentages for each number instead of the source values. I did calculate the percentages for the bar graph, but I did not use or show them for the chi squared calculation. Sorry if I misunderstood your meaning.Metsfanmax wrote:Please be a little more specific about the calculation you did. The null hypothesis is that the dice are fair, so the expected frequency of ones for each user is 1/6 of their total number of rolls. You turn the observed number of ones/twos/threes/etc. into an observed frequency by dividing by the number of rolls for each user (e.g. the upper left cell would be 0.163). Once you calculate the chi-squared value (the sum of the squared deviations from that expected frequency, divided by the expected frequency), you then turn it into a p-value, given N = 10 degrees of freedom. Is that number in your final row, the p-value for each number?
I believe I asked and answered the most relevant question: For a given set of players, what is the probability that the number of 1's they rolled could have occurred from random chance, assuming the dice are fair?Metsfanmax wrote:When doing statistics you have to be very careful to know what question you're actually asking (hence the danger of just pressing the Excel chi-squared button ;-P). In this case, there are two questions we may ask.
1) For a given player, what is the probability that their die rolls could have occurred from random chance, assuming the dice are fair?
2) For a given set of players, what is the probability that their die rolls could have occurred from random chance, assuming the dice are fair?
If we wanted to answer the first question, we would perform the calculation I linked to by summing up the squared differences of the number of ones, twos, etc. and the expected average (4524.5), and dividing by that average. We would get a chi^2 value of 7.2. There are 6-1 = 5 degrees of freedom in this sample (since there are 6 possible outcomes for the die). Consulting the Wiki page shows that this has a p-value of approximately 0.20. This means that a distribution of dice at least as non-uniform as this would occur 20% of the time you performed this experiment (this is not enough to reject the hypothesis that the dice are fair -- if this would occur 20% of the time with random dice, there's little confidence in concluding the dice are unfair). If you are uncertain, just do your Excel chi-squared test on the first row, using 4524.5 as the expected frequency for each column. It should give you something similar to what I calculated.
Note that the actual number of dice rolls doesn't factor into this analysis explicitly. We have more confidence in our results because the dice have been rolled several thousand times, but you could do this analysis for one die roll or 10 or 100,000 and get a p-value if you want. This is why statistics is tricky -- you can calculate all you want, but you need to be careful in how you apply it. 30,000 rolls is enough to be fairly confident that we have a decent sample though.
A: 0.0000035 (For this set of players)
I chose players who joined this year to demonstrate that this is an ongoing problem.
I thought that a bias for an individual player might not show up well with what I considered to be only a moderate sample size, but I've added it here:

My calculation matches yours for PhillyO, but what about zoper and Pindaroo? Seeing those values among the first 10 players I looked at does not give me much confidence that the dice are fair. I also looked at the stats for the first 25 people who posted in this thread:

It looks like a much larger sample size (>300,000 rolls) is needed to have a high level of confidence in a player's p-value. But however you look at it, the dice are not fair.
-
frankiebee
- Posts: 493
- Joined: Wed Nov 08, 2006 2:05 pm
- Gender: Male
- Location: Wildervank/Leeuwarden
Re: Which number do you roll the most?
Impressive data, my p value is pretty good 

Re: Which number do you roll the most?
Like my stats teacher always said: "If the p is low, you have to reject the H0"
Pretty sure the dice are slanted positively in most cases.
Yeah, that's why I wasn't winning games before.
Pretty sure the dice are slanted positively in most cases.
Yeah, that's why I wasn't winning games before.
-
Metsfanmax
- Posts: 6619
- Joined: Wed Apr 11, 2007 11:01 pm
- Gender: Male
Re: Which number do you roll the most?
My response to that post got eaten up by the forum reset. The gist is this: low p-value is not the final answer. It is one technique you can use, and is often useful. But you should be skeptical of a p-value that's basically zero. This is the effect of too large of a sample size. It means that simple chi-squared analysis is not really adequate for studying this when we're dealing with hundreds of thousands of rolls.nàme wrote:Like my stats teacher always said: "If the p is low, you have to reject the H0"
Pretty sure the dice are slanted positively in most cases.
Yeah, that's why I wasn't winning games before.
Re: Which number do you roll the most?
Not sure if serious... but I was curious, so I ran some simulations. With the dice very slightly biased like I'm seeing in the actual data, the attacker's win rate (3v2) of 53.98% was only 0.002% higher than for "unbiased" pseudo-random dice over 1,000,000 battles. Essentially an undetectable change, so sorry, you can't blame your win rate on biased dice.nàme wrote:Like my stats teacher always said: "If the p is low, you have to reject the H0"
Pretty sure the dice are slanted positively in most cases.
Yeah, that's why I wasn't winning games before.
Then I ran the test again to see what it would be like for extremely biased dice where 1 never shows up. For that test, the attacker's win rate dropped to 51.5%. It would change the game a bit, but since the dice do not favor one player over another as far as I can tell, it would not give anyone an unfair advantage.
Here's a graph of the data from the previous table for the first 25 posters:Metsfanmax wrote:My response to that post got eaten up by the forum reset. The gist is this: low p-value is not the final answer. It is one technique you can use, and is often useful. But you should be skeptical of a p-value that's basically zero. This is the effect of too large of a sample size. It means that simple chi-squared analysis is not really adequate for studying this when we're dealing with hundreds of thousands of rolls.
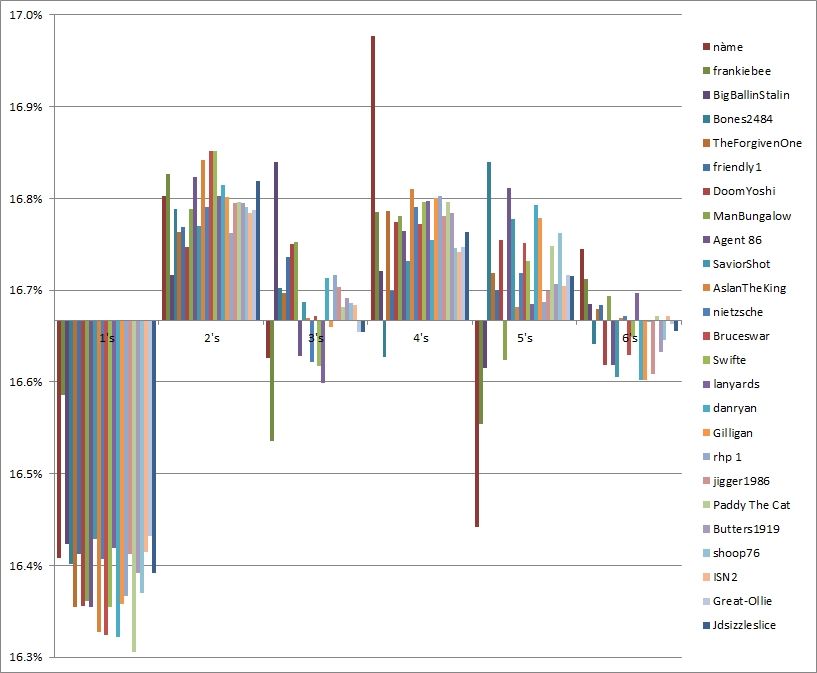
The p-value for 3's and 6's is 0.37 and 0.82 respectively, even though there are over 5.5 million samples for each. The others have a p-value of 0. I don't see how anyone could look at this and not think that there is something wrong with the dice generation. The only question seemed to be whether it was still going on, but since the graph for players who joined this year shows the same pattern, I think it's safe to say that it has not been fixed. (Unless there has been some very recent change that was not published.)

Re: Which number do you roll the most?
Looking at the numbers of many members the numbers still continue to be the same..2's and 4's. I roll mostly 2's so to the members who roll more 4's we can watch you at the top of the scoreboard

We are the Fallen, an unstoppable wave of Darkness.
Re: Which number do you roll the most?
While your sample size is small the results are shocking to me. The trend of more 6's over 1's and more 2's over 5's deserves more analysis and a larger sample to correctly sate a bias. My personal dice stats conform exactly to this trend...degaston wrote:I interpreted this to mean that you were saying that the calculation should be performed using the percentages for each number instead of the source values. I did calculate the percentages for the bar graph, but I did not use or show them for the chi squared calculation. Sorry if I misunderstood your meaning.Metsfanmax wrote:Please be a little more specific about the calculation you did. The null hypothesis is that the dice are fair, so the expected frequency of ones for each user is 1/6 of their total number of rolls. You turn the observed number of ones/twos/threes/etc. into an observed frequency by dividing by the number of rolls for each user (e.g. the upper left cell would be 0.163). Once you calculate the chi-squared value (the sum of the squared deviations from that expected frequency, divided by the expected frequency), you then turn it into a p-value, given N = 10 degrees of freedom. Is that number in your final row, the p-value for each number?
I believe I asked and answered the most relevant question: For a given set of players, what is the probability that the number of 1's they rolled could have occurred from random chance, assuming the dice are fair?Metsfanmax wrote:When doing statistics you have to be very careful to know what question you're actually asking (hence the danger of just pressing the Excel chi-squared button ;-P). In this case, there are two questions we may ask.
1) For a given player, what is the probability that their die rolls could have occurred from random chance, assuming the dice are fair?
2) For a given set of players, what is the probability that their die rolls could have occurred from random chance, assuming the dice are fair?
If we wanted to answer the first question, we would perform the calculation I linked to by summing up the squared differences of the number of ones, twos, etc. and the expected average (4524.5), and dividing by that average. We would get a chi^2 value of 7.2. There are 6-1 = 5 degrees of freedom in this sample (since there are 6 possible outcomes for the die). Consulting the Wiki page shows that this has a p-value of approximately 0.20. This means that a distribution of dice at least as non-uniform as this would occur 20% of the time you performed this experiment (this is not enough to reject the hypothesis that the dice are fair -- if this would occur 20% of the time with random dice, there's little confidence in concluding the dice are unfair). If you are uncertain, just do your Excel chi-squared test on the first row, using 4524.5 as the expected frequency for each column. It should give you something similar to what I calculated.
Note that the actual number of dice rolls doesn't factor into this analysis explicitly. We have more confidence in our results because the dice have been rolled several thousand times, but you could do this analysis for one die roll or 10 or 100,000 and get a p-value if you want. This is why statistics is tricky -- you can calculate all you want, but you need to be careful in how you apply it. 30,000 rolls is enough to be fairly confident that we have a decent sample though.
A: 0.0000035 (For this set of players)
I chose players who joined this year to demonstrate that this is an ongoing problem.
I thought that a bias for an individual player might not show up well with what I considered to be only a moderate sample size, but I've added it here:
My calculation matches yours for PhillyO, but what about zoper and Pindaroo? Seeing those values among the first 10 players I looked at does not give me much confidence that the dice are fair. I also looked at the stats for the first 25 people who posted in this thread:
It looks like a much larger sample size (>300,000 rolls) is needed to have a high level of confidence in a player's p-value. But however you look at it, the dice are not fair.


Re: Which number do you roll the most?
i roll 5 the most right now. after just under 180,000 dice, i have rolled the exact same number of 2's and 6's. my order is 5,4,3,6 and 2 tied, 1
my opponent rolls 4 the most. 4,2,5,6,3,1.
i really don't care what i roll. i will take 2's all day if my opponent rolls 1's.
my opponent rolls 4 the most. 4,2,5,6,3,1.
i really don't care what i roll. i will take 2's all day if my opponent rolls 1's.
Re: Which number do you roll the most?
Both you and your opponents continue to show the bias against rolling 1's.
Re: Which number do you roll the most?
So no-one can see the pattern of the dice..random.org is not random 
We are the Fallen, an unstoppable wave of Darkness.
Re: Which number do you roll the most?
I don't think the problem is with random.org, but with how they are using it.Agent 86 wrote:So no-one can see the pattern of the dice..random.org is not random
I have no idea why they would pick dice rolls randomly from a list instead of generating the dice directly. It seems like a technique designed to introduce just the sort of problems we're seeing.rdsrds2120 wrote:I'll look to see if there's a technical reason that 1 is arbitrarily lower than the rest, but I performed a Chi-Square goodness of fit test for each of the 5 players rolls and that number of rolls isn't statistically significant. The p-value was essentially 0 each time...
For non stats people: Each set is, indivdually, within the margin of error to not cause alarm within the realm of randomness, but since the dice are read from a finite sheet randomly, perhaps there are a fewer number of ones than the rest.
As for why the p-values were 0, I don't think it's because the number of rolls was too small, but because the results are biased.
I used random.org to simulate 3000 rolls for 10 players. Here's what they looked like:

...and here are the p-values:

This is what we should be seeing from the game, but I haven't seen any follow up from the administrators on this, so I guess they aren't concerned.
-
Metsfanmax
- Posts: 6619
- Joined: Wed Apr 11, 2007 11:01 pm
- Gender: Male
Re: Which number do you roll the most?
Generating good random numbers is hard. If we used a local PRNG, the results would almost certainly be worse than random.org because of how many rolls we have. And generating them on demand requires a lot of compute power given how many rolls we process every second.degaston wrote: I have no idea why they would pick dice rolls randomly from a list instead of generating the dice directly. It seems like a technique designed to introduce just the sort of problems we're seeing.
Why would the technique we use introduce the problems you think you see?
How concerned should the administrators be? Is there a reason to suspect that certain players are advantaged because of what you think you see?This is what we should be seeing from the game, but I haven't seen any follow up from the administrators on this, so I guess they aren't concerned.
-
rhp 1

- Posts: 1285
- Joined: Fri Sep 14, 2007 5:19 pm
- Location: IF YOU HAVE NO CLUE WHAT YOU'RE DOING, IT IS BEST TO DO IT....... QUICKLY
Re: Which number do you roll the most?
I'm not in the mood to delve into the technical/statistical aspect of this discussion... but if the dice are somehow "unfair", so? I mean, I believe they're about as fair as one could reasonably hope, and no one person can say they are more or less fair for him than others... it would be impossible to prove/quantify... but fun nonsense to talk about I suppose...
Re: Which number do you roll the most?
I can't really explain it since I don't know exactly how you are generating your numbers now. rdsrds2120's comment about "reading numbers from a finite sheet randomly", and "perhaps there are a fewer number of ones than the rest" made it sound as though there was a large list of numbers 1-6, and a random number was being used to pick one of those numbers. If all dice rolls are not represented equally, or if they do not all have an equal chance of being picked, then that could be the cause of the problem. If that's not how it's being done, then maybe you could explain the process?Metsfanmax wrote:Generating good random numbers is hard. If we used a local PRNG, the results would almost certainly be worse than random.org because of how many rolls we have. And generating them on demand requires a lot of compute power given how many rolls we process every second.degaston wrote: I have no idea why they would pick dice rolls randomly from a list instead of generating the dice directly. It seems like a technique designed to introduce just the sort of problems we're seeing.
Why would the technique we use introduce the problems you think you see?
How concerned should the administrators be? Is there a reason to suspect that certain players are advantaged because of what you think you see?This is what we should be seeing from the game, but I haven't seen any follow up from the administrators on this, so I guess they aren't concerned.
My concern is not that this gives any particular player an advantage, or affects the outcome of any games, but that it may give some validation to those who say that the dice are rigged in some way. I haven't found one yet, but there may be a player out there who has rolled 1's more than the expected 16.6% of the time. How do you explain to him that the dice are fair when almost everyone else rolls fewer than the expected number of 1's. (and if there are no such players, then doesn't that just prove that there's a bias?) Shouldn't unbiased dice rolls be one of the top priorities of this site?
If computing power and/or response time is a problem, then it should be pretty easy to generate and store random dice rolls in the background or during slower periods and have them ready to use during higher loads. And as for using local PRNG, this site should have tons of random events from all the user interaction that could be used to seed unpredictable, non-repeating, and non-biased dice rolls.
-
Metsfanmax
- Posts: 6619
- Joined: Wed Apr 11, 2007 11:01 pm
- Gender: Male
Re: Which number do you roll the most?
That is how it works. But the only way this could lead to an uneven distribution over long periods of time is if the sheets themselves (which IIRC are 50k numbers each) are consistently biased to have fewer 1's than other numbers, in which case the problem is on random.org and not our method.degaston wrote:I can't really explain it since I don't know exactly how you are generating your numbers now. rdsrds2120's comment about "reading numbers from a finite sheet randomly", and "perhaps there are a fewer number of ones than the rest" made it sound as though there was a large list of numbers 1-6, and a random number was being used to pick one of those numbers. If all dice rolls are not represented equally, or if they do not all have an equal chance of being picked, then that could be the cause of the problem. If that's not how it's being done, then maybe you could explain the process?Metsfanmax wrote:Generating good random numbers is hard. If we used a local PRNG, the results would almost certainly be worse than random.org because of how many rolls we have. And generating them on demand requires a lot of compute power given how many rolls we process every second.degaston wrote: I have no idea why they would pick dice rolls randomly from a list instead of generating the dice directly. It seems like a technique designed to introduce just the sort of problems we're seeing.
Why would the technique we use introduce the problems you think you see?
How concerned should the administrators be? Is there a reason to suspect that certain players are advantaged because of what you think you see?This is what we should be seeing from the game, but I haven't seen any follow up from the administrators on this, so I guess they aren't concerned.
For the same reason that it's fair when the distribution is perfectly even; some players will roll more 1's than 6's in this case for any finite number of rolls. That's in the nature of randomness. It would be unreasonable and unrealistic for everyone to get exactly the same amount of each number, so some people will get more 6's than the true distribution and some people will get more 1's. This happens whether or not the true, underlying distribution is perfectly even.My concern is not that this gives any particular player an advantage, or affects the outcome of any games, but that it may give some validation to those who say that the dice are rigged in some way. I haven't found one yet, but there may be a player out there who has rolled 1's more than the expected 16.6% of the time. How do you explain to him that the dice are fair when almost everyone else rolls fewer than the expected number of 1's.
It's a moot point. random.org gives high quality numbers; you used them in an example yourself that demonstrated that the numbers are good. So why would we bother generating our own?If computing power and/or response time is a problem, then it should be pretty easy to generate and store random dice rolls in the background or during slower periods and have them ready to use during higher loads. And as for using local PRNG, this site should have tons of random events from all the user interaction that could be used to seed unpredictable, non-repeating, and non-biased dice rolls.
Re: Which number do you roll the most?
Curiosity has driven me to dig a little deeper. I randomly pulled 50 different players from all different ranks. I found only 2 players who have rolled more 1's than 6's. That is statistically significant. Further, while I find many players whose average roll is 3.51 and some at 3.52, I was only able to find 1 player with an average below 3.5. Player mondegreen must be the unluckiest player in CC. Although his roll total is low. This suggests some bias in the numbers CC is getting. My first thought would be that defense has a bit more value but other than that I am not sure what benefit is gained. I may also have found the luckiest player in CC...chess1king.
Re: Which number do you roll the most?
Just to be clear, you're saying there's a list of 50k numbers, 1 through 6, in some "random" order, where the total occurrences for each number are equal? Then a random number is retrieved from random.org from 1 to 50,000, and that number is used to pick a dice roll from the sheet? If that's true, I'd like to know how that is supposed to be better than requesting a number from 1-6 from random.org.Metsfanmax wrote:That is how it works. But the only way this could lead to an uneven distribution over long periods of time is if the sheets themselves (which IIRC are 50k numbers each) are consistently biased to have fewer 1's than other numbers, in which case the problem is on random.org and not our method.degaston wrote: I can't really explain it since I don't know exactly how you are generating your numbers now. rdsrds2120's comment about "reading numbers from a finite sheet randomly", and "perhaps there are a fewer number of ones than the rest" made it sound as though there was a large list of numbers 1-6, and a random number was being used to pick one of those numbers. If all dice rolls are not represented equally, or if they do not all have an equal chance of being picked, then that could be the cause of the problem. If that's not how it's being done, then maybe you could explain the process?
I agree that it would be unreasonable and unrealistic for everyone to get the exact same amount of each number. Do you agree that it's also unrealistic and unreasonable for everyone to roll 1's less than 1/6 of the time? Can you find anyone with a significant number of games who has rolled 1's more than 1/6 of the time?Metsfanmax wrote:For the same reason that it's fair when the distribution is perfectly even; some players will roll more 1's than 6's in this case for any finite number of rolls. That's in the nature of randomness. It would be unreasonable and unrealistic for everyone to get exactly the same amount of each number, so some people will get more 6's than the true distribution and some people will get more 1's. This happens whether or not the true, underlying distribution is perfectly even.degaston wrote:My concern is not that this gives any particular player an advantage, or affects the outcome of any games, but that it may give some validation to those who say that the dice are rigged in some way. I haven't found one yet, but there may be a player out there who has rolled 1's more than the expected 16.6% of the time. How do you explain to him that the dice are fair when almost everyone else rolls fewer than the expected number of 1's.
Yes, random.org's numbers appear to be good. So why are you picking from a sheet of numbers instead of getting the dice rolls directly from them?Metsfanmax wrote:It's a moot point. random.org gives high quality numbers; you used them in an example yourself that demonstrated that the numbers are good. So why would we bother generating our own?degaston wrote:If computing power and/or response time is a problem, then it should be pretty easy to generate and store random dice rolls in the background or during slower periods and have them ready to use during higher loads. And as for using local PRNG, this site should have tons of random events from all the user interaction that could be used to seed unpredictable, non-repeating, and non-biased dice rolls.
-
Metsfanmax
- Posts: 6619
- Joined: Wed Apr 11, 2007 11:01 pm
- Gender: Male
Re: Which number do you roll the most?
We pull a list of 50,000 random numbers from random.org. We then read the list out in sequence every time a roll is performed, and let the list wrap around continuously.degaston wrote:Just to be clear, you're saying there's a list of 50k numbers, 1 through 6, in some "random" order, where the total occurrences for each number are equal? Then a random number is retrieved from random.org from 1 to 50,000, and that number is used to pick a dice roll from the sheet? If that's true, I'd like to know how that is supposed to be better than requesting a number from 1-6 from random.org.Metsfanmax wrote:That is how it works. But the only way this could lead to an uneven distribution over long periods of time is if the sheets themselves (which IIRC are 50k numbers each) are consistently biased to have fewer 1's than other numbers, in which case the problem is on random.org and not our method.degaston wrote: I can't really explain it since I don't know exactly how you are generating your numbers now. rdsrds2120's comment about "reading numbers from a finite sheet randomly", and "perhaps there are a fewer number of ones than the rest" made it sound as though there was a large list of numbers 1-6, and a random number was being used to pick one of those numbers. If all dice rolls are not represented equally, or if they do not all have an equal chance of being picked, then that could be the cause of the problem. If that's not how it's being done, then maybe you could explain the process?
Yes, random.org's numbers appear to be good. So why are you picking from a sheet of numbers instead of getting the dice rolls directly from them?
http://www.conquerclub.com/forum/viewto ... 4&t=120373
There are obvious performance reasons why we wouldn't want to get individual rolls from random.org as they happen. Much faster to pre-load the numbers and read them out in sequence.
Re: Which number do you roll the most?
Thanks for the feedback. This makes much more sense than what I thought was being described. I could use a little more clarification, though.Metsfanmax wrote:We pull a list of 50,000 random numbers from random.org. We then read the list out in sequence every time a roll is performed, and let the list wrap around continuously.
http://www.conquerclub.com/forum/viewto ... 4&t=120373
There are obvious performance reasons why we wouldn't want to get individual rolls from random.org as they happen. Much faster to pre-load the numbers and read them out in sequence.
You say you "let the list wrap around continuously.", and in the first post of the thread you linked, Lack says "When the last number in the series is read, we "rewind" and continue with the first number in the series". But a few posts down, Ace Rimmer says "After those 50k are used, a new batch of 50k random numbers is retrieved from random.org".
So which is it? If it's the way you and Lack described, that could very easily account for the bias if the batch of 50,000 you're using has fewer 1's and more 2's and 4's. If it's the way Ace described, then something else is going on.
-
Metsfanmax
- Posts: 6619
- Joined: Wed Apr 11, 2007 11:01 pm
- Gender: Male
Re: Which number do you roll the most?
We were told that the list is replaced every hour. So one possible failure mode is if, for some reason, the list is no longer updating and got stuck on a list that was particularly non-uniform. But if the lists are still updating once per hour, then your explanation would require the sum total of those lists to be non-uniform.degaston wrote:Thanks for the feedback. This makes much more sense than what I thought was being described. I could use a little more clarification, though.Metsfanmax wrote:We pull a list of 50,000 random numbers from random.org. We then read the list out in sequence every time a roll is performed, and let the list wrap around continuously.
http://www.conquerclub.com/forum/viewto ... 4&t=120373
There are obvious performance reasons why we wouldn't want to get individual rolls from random.org as they happen. Much faster to pre-load the numbers and read them out in sequence.
You say you "let the list wrap around continuously.", and in the first post of the thread you linked, Lack says "When the last number in the series is read, we "rewind" and continue with the first number in the series". But a few posts down, Ace Rimmer says "After those 50k are used, a new batch of 50k random numbers is retrieved from random.org".
So which is it? If it's the way you and Lack described, that could very easily account for the bias if the batch of 50,000 you're using has fewer 1's and more 2's and 4's. If it's the way Ace described, then something else is going on.
Re: Which number do you roll the most?
The results I've seen are exactly what I would expect if the list was not being replaced. A small bias in a list 50,000 numbers would be reinforced every time the list was re-used. It would take just 139 fewer 1's, 66 extra 2's, etc. to achieve this result. Well within what you could expect from a random list of 50,000.Metsfanmax wrote:We were told that the list is replaced every hour. So one possible failure mode is if, for some reason, the list is no longer updating and got stuck on a list that was particularly non-uniform. But if the lists are still updating once per hour, then your explanation would require the sum total of those lists to be non-uniform.
As you posted in the dice thread back in 2010, "we'll believe that there's a problem if you show us the evidence. ...demonstrate that there's some sort of bias in the dice. If you do that, we're not going to ignore the evidence". (http://www.conquerclub.com/forum/viewto ... 0#p2748566) I realize that you were talking to people who felt that the dice were biased against them personally, but I think I've provided plenty of evidence that the dice have a small, but consistent bias against rolling 1's.
-
happy2seeyou

- Posts: 4022
- Joined: Mon Jan 22, 2007 2:59 pm
- Gender: Female
- Location: A state that is in the shape of a mitten!
- Contact:

-
Metsfanmax
- Posts: 6619
- Joined: Wed Apr 11, 2007 11:01 pm
- Gender: Male
Re: Which number do you roll the most?
You can trust that I have taken notice, and I hope it's evident that I'm not ignoring your results. But this result is still not enough to prove that the dice are non-uniform when considered sitewide, since there could be some hidden selection bias in your sample (which is small compared to the site as a whole). More importantly, since this effect is relatively small, if you want this to be a site priority then you need to collect the data suggesting that the dice are not fair.degaston wrote:The results I've seen are exactly what I would expect if the list was not being replaced. A small bias in a list 50,000 numbers would be reinforced every time the list was re-used. It would take just 139 fewer 1's, 66 extra 2's, etc. to achieve this result. Well within what you could expect from a random list of 50,000.Metsfanmax wrote:We were told that the list is replaced every hour. So one possible failure mode is if, for some reason, the list is no longer updating and got stuck on a list that was particularly non-uniform. But if the lists are still updating once per hour, then your explanation would require the sum total of those lists to be non-uniform.
As you posted in the dice thread back in 2010, "we'll believe that there's a problem if you show us the evidence. ...demonstrate that there's some sort of bias in the dice. If you do that, we're not going to ignore the evidence". (http://www.conquerclub.com/forum/viewto ... 0#p2748566) I realize that you were talking to people who felt that the dice were biased against them personally, but I think I've provided plenty of evidence that the dice have a small, but consistent bias against rolling 1's.